Wednesday 28 March 2012

Climate Change is Real


With a heavy heart I have to concede that the Greenshirts were right all the time. There is such a thing as climate change. And it's damaging Scottish agriculture:


Click on image for details. There's plenty more at the excellent Real Science website.

And there's drought in Britain:


And the following pillars of propriety agree that we're going to hell in a handbasket:

Oxfam       WWF     Greenpeace    Friends of the Earth  10:10  350.org  Prince Charles
UK Government

Now these authorities wouldn't alarm the public unneccessarily, would they? Here are some examples of their pearls of wisdom:

Oxfam: "We're huge supporters of the proposed Robin Hood tax."
WWF: "Adopt a polar bear."
Greenpeace: "Nuclear power will cost the Earth... renewable energy...cheapest... solution."
FoE: "The world is warming and we humans are the cause."
10:10: "What if everyone... got involved? City councils, post offices... donkey sanctuaries..."
350: "Building a climate movement in Afghanistan isn't esay."
Prince Charles: "we have just 96 months to avert 'irretrievable climate and ecosystem collapse' "
UK Gov't: "The UK is committed to reducing its greenhouse gas emissions by at least 80% by 2050"

The reader may detect a hint of irony here. But there's a serious issue here, so I'll drop the mockery and talk straight. Environmental extremists have played a very shrewd game; they have manoeuvred their crazy scare story into mainstream thought. The major green groups - once earnest and sincere nature lovers - have been taken over by extreme lefties with an antidevelopment, anticapitalist agenda. These uebergreen groups have managed to influence public policy, at least in the West. On one level one is forced admire their skill and determination. They have taken over the establishment and, with that access, gained vast funding for propaganda purposes. Using the public's own money to finance a public disinformation programme is pretty darn cunning! I suspect that our politicians have been slightly yellow-bellied, fearing that the violent tactics of animal rights extremists might descend on them and their families, and hence given them free passage. Or maybe our senior politicians actually believe this nonsense having watched An Inconvenient Truth. Or - and this interpretation hurts the most - it's the Chief Scientific Advisors who bear most of the blame, spouting the Global Warming hogwash to their political masters and ushering in the 'carbon' fixation. (Ferchrissakes, these people have sublime advocacy skills! Who'd have thought it possible to trash the reputation of a member of the Periodic Table?! Oxygen is wondering if he's safe and poor old Nitrogen is expecting a midnight raid.)

But as the pesky planet refuses to cooperate with their dire warnings, as Global Warming fails to materialise, the days of this scam are numbered. The laws of physics are not subject to hype, and the gullible public is slowly coming to realise it's been conned. There's some way to go yet, such is the power and momentum of these wicked vested interests: I fear that this craziness may endure another decade, but eventually 'the truth will out', the man in the street will growl that the Globe ain't bloody Warming, and extreme-greenery with its carbon taxes, its monstrous windmills, its impoverishment of the less well-heeled will fail. Global Warmery will become electoral suicide for politicians who currently walk in fear of green activists.


Saturday 17 March 2012

Let's get SORTED!

It's midwinter with Vinersnow covering the country. Heating fuel is expensive. Even so, you want your family to be comfortable. So what do you do? You set the timer to switch on the heating at getting-up time, and to switch it off at departure time when people go off to work and school.

But the family isn't happy. They complain that they go from warm beds to frosty bathrooms, and then leave the house when the place has finally warmed up. What do you do? You advance the heating timer by an hour. Or maybe, in a smaller place, by a half hour.

This time lag is known to Control Engineers as transient response. The principles behind the steering of a guided missile, the tuning of a vehicle suspension and the adaptation of a thermal system are one and the same. In each case, a certain mass (or thermal capacity) is acted on by a certain force (or thermal power) and accelerates (or undergoes a rate of temperature change) to a terminal velocity (equilibrium temperature) at which force and drag (drivers and losses) balance. The maths describing resonance can be darn complicated but the differential equations - precise and quantified - do correspond to common sense and to our intuitive sense of how the physical world works.

I have a conjecture (called SORT for short) that the Earth has just such a transient response, and that changes in solar activity are NOT immediately reflected in global temperatures but after a timelag. Or rather two timelags. They are quantifiable: 99 years and 152 years.

I use the expression conjecture as opposed to hypothesis or theory for the following reason: The vile philosophy of Postmodern Science has lowered what businesssmen know as 'barriers to entry': the things which make it hard for a new player to start up in competition and take a chunk of your market. In many sciences the bar has been lowered, with the result that half-baked 'theories' are entering the corpus. Raddled by cop-out language such as "suggests that" and "may indicate" and "an apparent correlation", wishy-washy notions are announced and taken seriously rather than being howled down as premature enunciation. This is corrupt with a small 'c'; much of this pseudoscientific trash is announced in press releases which are ill-disguised pitches for money: "Subject to the availability of funding, this promising work may lead to important advances."

My Solar Oceanic Response Timelag conjecture is what it says on the tin: a conjecture. With luck it will develop into a hypothesis which will either be refuted (ah, well, so be it) or confirmed, in which case it will be promoted to a theory. If it does manage to reach the happy status of a theory, SORT may still be demolished by subsequent contrary evidence. All science worthy of the name is only as good as its last game. Not for us the dogmatic twaddlespeak of "the science is settled" - a corrupt notion which religion has bequeathed to its fellow-traveller, the Cult of Global Warmery.

Enough blather. Here's the beef.

Consider these three time series:

 Do you see any correlation between them? No, neither do I. How about these?

See what I've done? I've shifted the oscillations in the Atlantic leftwards - and 99 years into the past. Ditto for the pacific, but by 152. Well, I for one can see a match. We're surely all agreed that correlation is not causation, but correlation is the scent which leads the pig to the truffles - it's just the start of a hunt. If we think these matches are more than pure fluke, the hard work lies in the future: to explain the mechanisms within the laws of physics and, consequently, generate near-term forecasts. Result: death or glory, not the undead zombiedom of the Hockey Team with its limitless store of excuses for the pesky planet's refusal to warm up since 1998.

So the conjecture is this:
(a) Solar activity - of which one symptom is sunspots - is delivering a variable power to the Earth on a multidecadal scale. This variation is significantly greater than the modest variation in TSI being measured at present, and this variation may (I'm allowed that word - may - because it's only a conjecture!) be due to the Svensmark hypothesis or large variations in the mix of specific power (W/M^2) at different wavelengths.
(b) The transient response of the Atlantic is 99 years, and surface temperature measurements lag the energy arrivals due to its thermal mass, its vertical mixing and its currents.
(c) The Pacific's transient response is a greater 152 years due, of course, to its greater size.
(d) Atmospheric temperatures - or rather their fluctuations - are largely governed by fluctuations in sea surface temperatures. El Nino / La Nina is one - an important one, but only one - agent of these heat transfers between sea and air.

I see two problems with this conjecture: (i) The most authoritative measure of decadal atmospheric temperatures, i.e., the University of Alabama at Huntsville MSU-LT series, matches quite well the AMO but, given the phase difference between Atlantic and Pacific (not to mention the other oceans), energy exchanges between atmosphere and all the oceans must be considered. (ii) The last decade of the AMO is rather warmer than the solar activity of the Edwardian decade should have caused. If explaining away such anomalies entails many contortions and hedging (e.g., volcanic aerosols and (pah!) greenhouse gases) it reduces the conjecture's attractiveness.


On the positive side, these three curves together suggest an imminent cooling spell of decades. The conjecture is thus falsifiable - a key ingredient of scientific integrity - and if temperatures exceed the 1998 peak at any time within the coming decades then this SORT conjecture is toast.

If SORT is real, we're in for some pretty chilly weather, but our grandchildren can look forward to barbecue summers and mild winters in c2060, when the 1960 sunspot peak pops back to say hello again.

Update 22 March 2012: Holzer and Primeau 2006 Paper
So why would a 'hot sun' in one century cause a hot ocean in a later one? Surely, one might say, the world would heat in the here-and-now rather than produce some later echo. Well, imagine a car's wheels going fast over a speed bump. Your head bumps the roof a few feet later on. Depending on your dampers, and how heavily loaded you are, the car bounces for a greater or shorter time after that "step change" as it's called in Control Engineering. Here are transient responses at different levels of damping:


Brown: underdamped, red: overdamped, green: critical damping with the shortest response time.

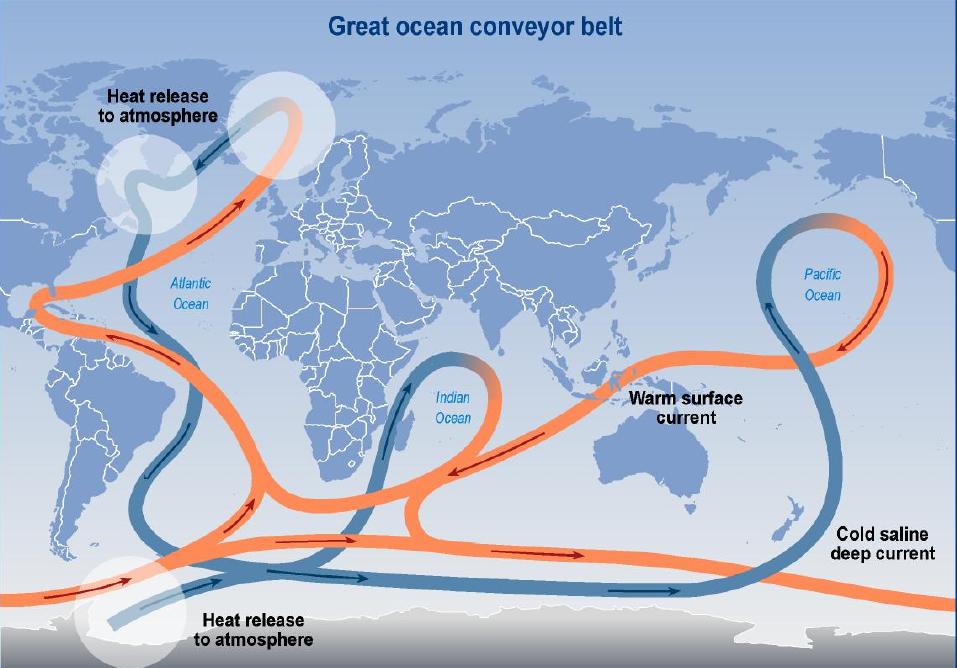
Now, we're all familiar with the "Great Ocean Conveyor", the curly wurly current which spans the globe. It was discovered as recently as 1991. The Cult of Global Warming has been spouting the nonsensical mantra, "the science is settled" since - what? - 1990? But we digress.


Now here's a little quiz question for you. Imagine a message in a bottle: how long would it take to get from, say, Tahiti to Iceland? A year, you might guess. Or maybe five or ten? You may well be right provided that that bottle stays "in the fast lane" and doesn't waste time along the way, dawdling in an eddy. It might even spend a few years in the Sargasso Sea. When you think about it, the conveyor metaphor was surely never intended to be taken literally - as a fixed-width flow moving at uniform speed. And here's another point: we're thinking about this in two dimensions. What's the speed of that current half way down to the seabed? Surely slower. What's its speed at even greater depth?

Of course there's no simple - or rather single - answer to the residence time question: it's a statistical distribution.

This paper makes a valiant attempt to answer the question: Holzer and Primeau 2006. They would have it that waters sinking in the N Atlantic resurface in the Pacific centuries later. As anyone with an inkling of fluid mechanics would intuit, there's a wide distribution of 'residence time', the peak being 1180 years, but they illustrate one fast-lane at 440 years and one slow-lane at 3130. It's mostly written in good English, with the occasional specialist term such as isopcyncal.


It's only a model. But there is some mention of being consistent with C14 dating of organic matter which surfaces.  What's important here is the order of magnitude of the residence time. If vast volumes of water are being taken from the surface to a multi-century hiding place, and then resurfacing, the notion of a 99- or 152-year SORT doesn't look crazy.

There's also evidence that fluctuations in atmospheric CO2 lags behind global temperatures by 900 years. If we can prove that the outgassing of the oceans is a 900-year transient response, then all the hysteria surrounding CO2 emissions will evaporate.

What data would we need to flesh out this conjecture? Watch this space. Better still, dear reader, contribute your thoughts and any evidence you may have encountered. What papers are out there giving a mathematical treatment of the oceans' CO2 budget over century timescales?


GISS - Strange Anomalies

The Goddard Institute for Space Studies is part of NASA. It's hard to think of better credentials. But if a cat may look at a king, the common man is still entitled to ask, "Where did they get that from? How did they reach those conclusions? What's their source data?"

Here is an image published by GISS, showing the astonishing and worrying overheating of the Arctic. This image is displayed prominently on the GISS website, http://data.giss.nasa.gov/gistemp/maps/. If you visit that site, press the "Make Map" button to generate the latest version of the image below.


Here's the same data, from a different perspective - above the North Pole. Just as alarming, yes?


Well, not so alarming in Antarctica, on the right. In fact, not alarming at all.

From the above you might assume that we have thermometers across the whole world. But that is not the case. There are gaps; those gaps are papered over by 'smearing': the thermometer we have got is deemed to have a 1200km radius or 2400km diameter. This is not a joke! I know that you wouldn't read a thermometer in London and asume that the people of Corsica and Oslo need the same clothes today as you.  But that is precisely what they are doing. Look! 1200km:


Changing that 1200km setting to 250km we get this:


Whoa! It's no longer the North Pole that's roasting. It's mostly Canada, Russia, Alaska. Note the grey areas! They say "no data". Next question: just how close to the Pole do we go? Well, it's here:


And where is "here"? It's the famous Svalbard. Once the barely habitable end-of-the-Earth, today an important centre of the Global Warming Industry, with loads of inward investment following the influx of climate researchers. How many climatologists does it take to read a thermometer?

Let's look at the temperature record at Svalbard:

Wow! It HAS been getting hot fast there! But it's strange that the data only go back to 1978. Let's look for a place in the far North with a nice long record of temperatures. There's a place in Northern Rusia - at 73.5N rather than Svalbad's 78.2N, but it has a record going all the way back to 1918. Trouble is.... the historical record is changing. Repeat: the historical record is changing.

Version 3 has replaced Version 2. Up until October 2011, GISS - the guardians and recipients of historic temperature records from around the world - published the v2 data (and still do, bless 'em). They replaced it with v3. Maybe there were measurement errors in 1940; how would they detect this in 2011? Other than sanitising the odd stick-out-like-sore-thumb, they couldn't. They use... ah... creativity.

See how the shape has changed? Try to draw a 'best line' through the two graphs and your right-hand line (unlike the left-hand one) will have an upward slope. Bingo! We have created a warming trend by (yes, I agree that it's a wicked deception) making the early record colder! The 'revised' version is not quite a 'hockey stick', but it's closer to one than it was before. This is the time-honoured trick of 'revisionism'. As George Orwell wrote in Nineteen Eighty-Four, "Who controls the past controls the future. Who controls the present controls the past."

You can check for yourself the data published by GISS at http://data.giss.nasa.gov/gistemp/station_data_v2/  and  http://data.giss.nasa.gov/gistemp/station_data/ (v3).On the map at the bottom, click northern Russia and a list will appear. Choose the station of your choice, such as Ostrov Dikson. Or better, repeat my Ostrov exercise for some other location and let me know if I have been cherrypicking.

Let's be clear about what seems to be happening here. It seems that GISS are fiddling the figures to give the appearance of a warming trend in the Arctic where none exists. This is a corruption of science in the service of a political agenda. Why in the Arctic? Because the general public are increasingly sceptical of overhyped "Catastrophic Anthropogenic Global Warming" where they live, and this is a last-ditch effort to maintain the scare story. They're saying (that is, the Climatographers... they don't deserve an 'ology') "hah! It's maybe not roasting hot where you live mate, but in these remote places we see what you cannot. Stop being parochial and look at the big picture."

The rapid warming of the Arctic is a fiction. Global Warming is a fiction, and the perpetrators of this wicked myth are making their last stand in the Arctic.

Let's pick another Arctic station. Teigarhorn on Iceland. This is how they do it:
    
 See what they've done? They've suppressed the temperatures from 1903 to 1962 by 0.9C, and inflated the late 1960s by 0.8C. (Unfortunately, the record ends there.) Does it look like a hockey stick to you?

Here's a couple of actual screen-grabs (apart from the v2 & v3 titles I added) for Jan, Feb, Mar.

 January 1900 was declared at 0.7C until October 2011 - the Version 2 figures. By December 2011 GISS had rewritten the past and deemed this place in Iceland to be below freezing, -0.2C.

 You can visit this selfsame NASA GISS website and see with your own eyes. The process is:
                              1. Go to GISS's v2 or page (link above)
                              2. Scroll down to clickable map of the world
                              3. Click on area of choice (e.g. Canada): a list of stations appears
                              4. Click on station of your choice: a time-series graph appears
                              5. Below the graph is a link: "Download monthly data as text"
                              6. Decide which temperatures need comparing with v3; note them down
                              7. Repeat for v3.


Recommended reading: Notalotofpeopleknowthat, a website created by Paul Homewood, who adopts a forensic approach to climatology. Paul quotes meteorologists in Iceland who are baffled by the deflation of their historic record.