Wednesday, 28 March 2012

Climate Change is Real


With a heavy heart I have to concede that the Greenshirts were right all the time. There is such a thing as climate change. And it's damaging Scottish agriculture:


Click on image for details. There's plenty more at the excellent Real Science website.

And there's drought in Britain:


And the following pillars of propriety agree that we're going to hell in a handbasket:

Oxfam       WWF     Greenpeace    Friends of the Earth  10:10  350.org  Prince Charles
UK Government

Now these authorities wouldn't alarm the public unneccessarily, would they? Here are some examples of their pearls of wisdom:

Oxfam: "We're huge supporters of the proposed Robin Hood tax."
WWF: "Adopt a polar bear."
Greenpeace: "Nuclear power will cost the Earth... renewable energy...cheapest... solution."
FoE: "The world is warming and we humans are the cause."
10:10: "What if everyone... got involved? City councils, post offices... donkey sanctuaries..."
350: "Building a climate movement in Afghanistan isn't esay."
Prince Charles: "we have just 96 months to avert 'irretrievable climate and ecosystem collapse' "
UK Gov't: "The UK is committed to reducing its greenhouse gas emissions by at least 80% by 2050"

The reader may detect a hint of irony here. But there's a serious issue here, so I'll drop the mockery and talk straight. Environmental extremists have played a very shrewd game; they have manoeuvred their crazy scare story into mainstream thought. The major green groups - once earnest and sincere nature lovers - have been taken over by extreme lefties with an antidevelopment, anticapitalist agenda. These uebergreen groups have managed to influence public policy, at least in the West. On one level one is forced admire their skill and determination. They have taken over the establishment and, with that access, gained vast funding for propaganda purposes. Using the public's own money to finance a public disinformation programme is pretty darn cunning! I suspect that our politicians have been slightly yellow-bellied, fearing that the violent tactics of animal rights extremists might descend on them and their families, and hence given them free passage. Or maybe our senior politicians actually believe this nonsense having watched An Inconvenient Truth. Or - and this interpretation hurts the most - it's the Chief Scientific Advisors who bear most of the blame, spouting the Global Warming hogwash to their political masters and ushering in the 'carbon' fixation. (Ferchrissakes, these people have sublime advocacy skills! Who'd have thought it possible to trash the reputation of a member of the Periodic Table?! Oxygen is wondering if he's safe and poor old Nitrogen is expecting a midnight raid.)

But as the pesky planet refuses to cooperate with their dire warnings, as Global Warming fails to materialise, the days of this scam are numbered. The laws of physics are not subject to hype, and the gullible public is slowly coming to realise it's been conned. There's some way to go yet, such is the power and momentum of these wicked vested interests: I fear that this craziness may endure another decade, but eventually 'the truth will out', the man in the street will growl that the Globe ain't bloody Warming, and extreme-greenery with its carbon taxes, its monstrous windmills, its impoverishment of the less well-heeled will fail. Global Warmery will become electoral suicide for politicians who currently walk in fear of green activists.


Saturday, 17 March 2012

Let's get SORTED!

It's midwinter with Vinersnow covering the country. Heating fuel is expensive. Even so, you want your family to be comfortable. So what do you do? You set the timer to switch on the heating at getting-up time, and to switch it off at departure time when people go off to work and school.

But the family isn't happy. They complain that they go from warm beds to frosty bathrooms, and then leave the house when the place has finally warmed up. What do you do? You advance the heating timer by an hour. Or maybe, in a smaller place, by a half hour.

This time lag is known to Control Engineers as transient response. The principles behind the steering of a guided missile, the tuning of a vehicle suspension and the adaptation of a thermal system are one and the same. In each case, a certain mass (or thermal capacity) is acted on by a certain force (or thermal power) and accelerates (or undergoes a rate of temperature change) to a terminal velocity (equilibrium temperature) at which force and drag (drivers and losses) balance. The maths describing resonance can be darn complicated but the differential equations - precise and quantified - do correspond to common sense and to our intuitive sense of how the physical world works.

I have a conjecture (called SORT for short) that the Earth has just such a transient response, and that changes in solar activity are NOT immediately reflected in global temperatures but after a timelag. Or rather two timelags. They are quantifiable: 99 years and 152 years.

I use the expression conjecture as opposed to hypothesis or theory for the following reason: The vile philosophy of Postmodern Science has lowered what businesssmen know as 'barriers to entry': the things which make it hard for a new player to start up in competition and take a chunk of your market. In many sciences the bar has been lowered, with the result that half-baked 'theories' are entering the corpus. Raddled by cop-out language such as "suggests that" and "may indicate" and "an apparent correlation", wishy-washy notions are announced and taken seriously rather than being howled down as premature enunciation. This is corrupt with a small 'c'; much of this pseudoscientific trash is announced in press releases which are ill-disguised pitches for money: "Subject to the availability of funding, this promising work may lead to important advances."

My Solar Oceanic Response Timelag conjecture is what it says on the tin: a conjecture. With luck it will develop into a hypothesis which will either be refuted (ah, well, so be it) or confirmed, in which case it will be promoted to a theory. If it does manage to reach the happy status of a theory, SORT may still be demolished by subsequent contrary evidence. All science worthy of the name is only as good as its last game. Not for us the dogmatic twaddlespeak of "the science is settled" - a corrupt notion which religion has bequeathed to its fellow-traveller, the Cult of Global Warmery.

Enough blather. Here's the beef.

Consider these three time series:

 Do you see any correlation between them? No, neither do I. How about these?

See what I've done? I've shifted the oscillations in the Atlantic leftwards - and 99 years into the past. Ditto for the pacific, but by 152. Well, I for one can see a match. We're surely all agreed that correlation is not causation, but correlation is the scent which leads the pig to the truffles - it's just the start of a hunt. If we think these matches are more than pure fluke, the hard work lies in the future: to explain the mechanisms within the laws of physics and, consequently, generate near-term forecasts. Result: death or glory, not the undead zombiedom of the Hockey Team with its limitless store of excuses for the pesky planet's refusal to warm up since 1998.

So the conjecture is this:
(a) Solar activity - of which one symptom is sunspots - is delivering a variable power to the Earth on a multidecadal scale. This variation is significantly greater than the modest variation in TSI being measured at present, and this variation may (I'm allowed that word - may - because it's only a conjecture!) be due to the Svensmark hypothesis or large variations in the mix of specific power (W/M^2) at different wavelengths.
(b) The transient response of the Atlantic is 99 years, and surface temperature measurements lag the energy arrivals due to its thermal mass, its vertical mixing and its currents.
(c) The Pacific's transient response is a greater 152 years due, of course, to its greater size.
(d) Atmospheric temperatures - or rather their fluctuations - are largely governed by fluctuations in sea surface temperatures. El Nino / La Nina is one - an important one, but only one - agent of these heat transfers between sea and air.

I see two problems with this conjecture: (i) The most authoritative measure of decadal atmospheric temperatures, i.e., the University of Alabama at Huntsville MSU-LT series, matches quite well the AMO but, given the phase difference between Atlantic and Pacific (not to mention the other oceans), energy exchanges between atmosphere and all the oceans must be considered. (ii) The last decade of the AMO is rather warmer than the solar activity of the Edwardian decade should have caused. If explaining away such anomalies entails many contortions and hedging (e.g., volcanic aerosols and (pah!) greenhouse gases) it reduces the conjecture's attractiveness.


On the positive side, these three curves together suggest an imminent cooling spell of decades. The conjecture is thus falsifiable - a key ingredient of scientific integrity - and if temperatures exceed the 1998 peak at any time within the coming decades then this SORT conjecture is toast.

If SORT is real, we're in for some pretty chilly weather, but our grandchildren can look forward to barbecue summers and mild winters in c2060, when the 1960 sunspot peak pops back to say hello again.

Update 22 March 2012: Holzer and Primeau 2006 Paper
So why would a 'hot sun' in one century cause a hot ocean in a later one? Surely, one might say, the world would heat in the here-and-now rather than produce some later echo. Well, imagine a car's wheels going fast over a speed bump. Your head bumps the roof a few feet later on. Depending on your dampers, and how heavily loaded you are, the car bounces for a greater or shorter time after that "step change" as it's called in Control Engineering. Here are transient responses at different levels of damping:


Brown: underdamped, red: overdamped, green: critical damping with the shortest response time.

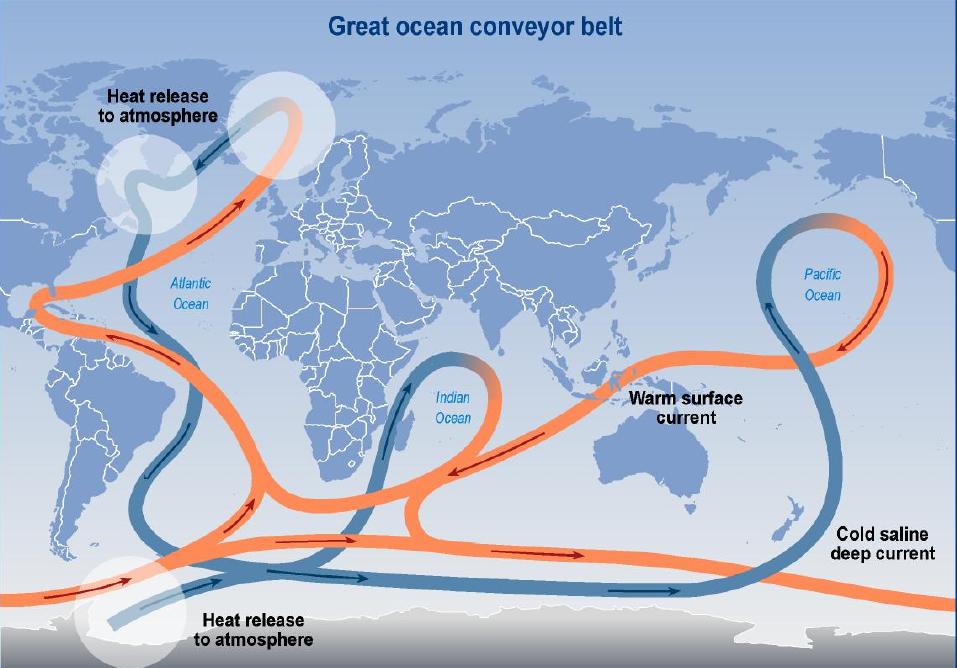
Now, we're all familiar with the "Great Ocean Conveyor", the curly wurly current which spans the globe. It was discovered as recently as 1991. The Cult of Global Warming has been spouting the nonsensical mantra, "the science is settled" since - what? - 1990? But we digress.


Now here's a little quiz question for you. Imagine a message in a bottle: how long would it take to get from, say, Tahiti to Iceland? A year, you might guess. Or maybe five or ten? You may well be right provided that that bottle stays "in the fast lane" and doesn't waste time along the way, dawdling in an eddy. It might even spend a few years in the Sargasso Sea. When you think about it, the conveyor metaphor was surely never intended to be taken literally - as a fixed-width flow moving at uniform speed. And here's another point: we're thinking about this in two dimensions. What's the speed of that current half way down to the seabed? Surely slower. What's its speed at even greater depth?

Of course there's no simple - or rather single - answer to the residence time question: it's a statistical distribution.

This paper makes a valiant attempt to answer the question: Holzer and Primeau 2006. They would have it that waters sinking in the N Atlantic resurface in the Pacific centuries later. As anyone with an inkling of fluid mechanics would intuit, there's a wide distribution of 'residence time', the peak being 1180 years, but they illustrate one fast-lane at 440 years and one slow-lane at 3130. It's mostly written in good English, with the occasional specialist term such as isopcyncal.


It's only a model. But there is some mention of being consistent with C14 dating of organic matter which surfaces.  What's important here is the order of magnitude of the residence time. If vast volumes of water are being taken from the surface to a multi-century hiding place, and then resurfacing, the notion of a 99- or 152-year SORT doesn't look crazy.

There's also evidence that fluctuations in atmospheric CO2 lags behind global temperatures by 900 years. If we can prove that the outgassing of the oceans is a 900-year transient response, then all the hysteria surrounding CO2 emissions will evaporate.

What data would we need to flesh out this conjecture? Watch this space. Better still, dear reader, contribute your thoughts and any evidence you may have encountered. What papers are out there giving a mathematical treatment of the oceans' CO2 budget over century timescales?


GISS - Strange Anomalies

The Goddard Institute for Space Studies is part of NASA. It's hard to think of better credentials. But if a cat may look at a king, the common man is still entitled to ask, "Where did they get that from? How did they reach those conclusions? What's their source data?"

Here is an image published by GISS, showing the astonishing and worrying overheating of the Arctic. This image is displayed prominently on the GISS website, http://data.giss.nasa.gov/gistemp/maps/. If you visit that site, press the "Make Map" button to generate the latest version of the image below.


Here's the same data, from a different perspective - above the North Pole. Just as alarming, yes?


Well, not so alarming in Antarctica, on the right. In fact, not alarming at all.

From the above you might assume that we have thermometers across the whole world. But that is not the case. There are gaps; those gaps are papered over by 'smearing': the thermometer we have got is deemed to have a 1200km radius or 2400km diameter. This is not a joke! I know that you wouldn't read a thermometer in London and asume that the people of Corsica and Oslo need the same clothes today as you.  But that is precisely what they are doing. Look! 1200km:


Changing that 1200km setting to 250km we get this:


Whoa! It's no longer the North Pole that's roasting. It's mostly Canada, Russia, Alaska. Note the grey areas! They say "no data". Next question: just how close to the Pole do we go? Well, it's here:


And where is "here"? It's the famous Svalbard. Once the barely habitable end-of-the-Earth, today an important centre of the Global Warming Industry, with loads of inward investment following the influx of climate researchers. How many climatologists does it take to read a thermometer?

Let's look at the temperature record at Svalbard:

Wow! It HAS been getting hot fast there! But it's strange that the data only go back to 1978. Let's look for a place in the far North with a nice long record of temperatures. There's a place in Northern Rusia - at 73.5N rather than Svalbad's 78.2N, but it has a record going all the way back to 1918. Trouble is.... the historical record is changing. Repeat: the historical record is changing.

Version 3 has replaced Version 2. Up until October 2011, GISS - the guardians and recipients of historic temperature records from around the world - published the v2 data (and still do, bless 'em). They replaced it with v3. Maybe there were measurement errors in 1940; how would they detect this in 2011? Other than sanitising the odd stick-out-like-sore-thumb, they couldn't. They use... ah... creativity.

See how the shape has changed? Try to draw a 'best line' through the two graphs and your right-hand line (unlike the left-hand one) will have an upward slope. Bingo! We have created a warming trend by (yes, I agree that it's a wicked deception) making the early record colder! The 'revised' version is not quite a 'hockey stick', but it's closer to one than it was before. This is the time-honoured trick of 'revisionism'. As George Orwell wrote in Nineteen Eighty-Four, "Who controls the past controls the future. Who controls the present controls the past."

You can check for yourself the data published by GISS at http://data.giss.nasa.gov/gistemp/station_data_v2/  and  http://data.giss.nasa.gov/gistemp/station_data/ (v3).On the map at the bottom, click northern Russia and a list will appear. Choose the station of your choice, such as Ostrov Dikson. Or better, repeat my Ostrov exercise for some other location and let me know if I have been cherrypicking.

Let's be clear about what seems to be happening here. It seems that GISS are fiddling the figures to give the appearance of a warming trend in the Arctic where none exists. This is a corruption of science in the service of a political agenda. Why in the Arctic? Because the general public are increasingly sceptical of overhyped "Catastrophic Anthropogenic Global Warming" where they live, and this is a last-ditch effort to maintain the scare story. They're saying (that is, the Climatographers... they don't deserve an 'ology') "hah! It's maybe not roasting hot where you live mate, but in these remote places we see what you cannot. Stop being parochial and look at the big picture."

The rapid warming of the Arctic is a fiction. Global Warming is a fiction, and the perpetrators of this wicked myth are making their last stand in the Arctic.

Let's pick another Arctic station. Teigarhorn on Iceland. This is how they do it:
    
 See what they've done? They've suppressed the temperatures from 1903 to 1962 by 0.9C, and inflated the late 1960s by 0.8C. (Unfortunately, the record ends there.) Does it look like a hockey stick to you?

Here's a couple of actual screen-grabs (apart from the v2 & v3 titles I added) for Jan, Feb, Mar.

 January 1900 was declared at 0.7C until October 2011 - the Version 2 figures. By December 2011 GISS had rewritten the past and deemed this place in Iceland to be below freezing, -0.2C.

 You can visit this selfsame NASA GISS website and see with your own eyes. The process is:
                              1. Go to GISS's v2 or page (link above)
                              2. Scroll down to clickable map of the world
                              3. Click on area of choice (e.g. Canada): a list of stations appears
                              4. Click on station of your choice: a time-series graph appears
                              5. Below the graph is a link: "Download monthly data as text"
                              6. Decide which temperatures need comparing with v3; note them down
                              7. Repeat for v3.


Recommended reading: Notalotofpeopleknowthat, a website created by Paul Homewood, who adopts a forensic approach to climatology. Paul quotes meteorologists in Iceland who are baffled by the deflation of their historic record.

Friday, 25 November 2011

Wanted: Antacronym of Viner

Usually, an acronym is a newly fabricated word constructed from the first letters of a phrase, GIGO being one example.

I'm trying to create its opposite from the letters VINER. Dr. David Viner, formerly of Norwich Poly (sorry, that should read "...of that revered seat of learning the University of East Anglia") has achieved immortality by his keynote declaration in 2000 that within a few years winter snowfall will become "a very rare and exciting event" and that, consequently, "children just aren't going to know what snow is."

Many a man would be embarrassed at having made such an assertation, and would salvage some vestige of credibility by retracting. Not so Dr. Viner, whose career in the GWI has flourished. Put yourself in the place of Dave's poor kids. "Daddy, what's that fluffy white stuff covering the back garden?" "Get AWAY from the windows, you little bastard! I've TOLD YOU BEFORE that we leave the curtains closed from October to March!"


So, what might a VINER be? What might the V stand for?

Sunday, 20 November 2011

Green Power

At risk of labouring the point, green awareness has been a largely positive change in western society, and progress in areas such as pollution and habitat preservation is to be welcomed. However, the mushrooming of the Environmental Advocacy Industry is sinister. Since being infiltrated by extremists, the likes of WWF and Greenpeace have moved a million miles from their grassroots origins.

WWF's income in 2010 was $224m in the US alone. Greenpeace's, worldwide, was €524m. Where does it all come from; where does it all go to? Such tsunamis of loot can buy a lot of influence. Put to good use, say to buy up habitat for endangered species, it could make a real difference; deployed on propaganda in perpetuating the Great Carbon Myth it is positively pernicious. This vast PR machine is pressuring governments to fritter away precious resource on renewable energy at a time of growing hardship and poverty for the common man.
The following post is on record, but it's immersed in a sea of information, so I thought I'd highlight it:

Daniel H says:
I worked at WWF as a programmer back in my early 20s and I was still sort of naive about global warming and environmentalism in general. The job was located at their Washington, DC headquarters and I was hired to create a new database for their “Climate Savers” program. The idea was to keep better track of the enormous revenue streams that they’d extort from Fortune 500 companies in exchange for not waging organized media campaigns against them (Nike, HP, Dupont, etc).
Their Climate Change Department was staffed by creepy fanatics who would run around screaming about how Bush stole the election and other crazy things about whales and “climate justice”. I was young and didn’t know what to make of it all so I just shrugged it off. Anyway, the head of the Climate Change Department was this freaky woman named Jenifer Morgan. We just called her “the forehead” because of her massive forehead[1]. She threatened to leave DC if Bush was not impeached for war crimes. She kept her promise and got transfered to Bonn, Germany along with her personal assistants.
Last I heard, she no longer works for WWF but continues to fly all around the world on behalf of her new environmentalist NGO.
The WWF headquarters building was a state of the art corporate complex with lots of plants but of course they kept the AC cranked up full blast during the hot DC summer months. In the basement there was a modern gym that employees were encouraged to use so I started using it after work. A lot of these guys who were “campaigners” would blatantly hit on me but I’d just ignore them and keep to myself. Later I stopped going to the gym after I personally witnessed some sort of lurid gay sex going on in the locker room.
I left WWF shortly thereafter.
Anyway, the shocking fanaticism and hypocrisy that I’d witnessed made me curious to learn more about the issue of climate change and what it was all about. That was when I officially became a skeptic.
True story.
I’m not surprised about that sick 9/11 exploitation campaign they ran because many of them were openly anti-American and seemed to think Bush was the Anti-Christ. The young activists were mostly rich white kids whose parents were well connected with DC politics and/or old money families. They grew up in privileged environments completely insulated from the world at large. For some reason they were all obsessed with people like Noam Chomsky. That’s pretty much it.
Whew…It felt good to get that off my chest! :-) Any questions

----------

This posting appeared in the WUWT post http://wattsupwiththat.com/2010/01/24/the-scandal-deepens-ipcc-ar4-riddled-with-non-peer-reviewed-wwf-papers/#comment-298859

Friday, 23 September 2011

Sunspots and Cloud Cover

As Bonnie Tyler might have sung, "We Need a Herschel".

In 1801 the genius astronomer William Herschel attempted to draw a correlation between the number of sunspots and the price of grain in London. In that era of data-paucity, it is staggering that he made such a leap with no prospect of establishing a causal relationship. And yet he did just that. Combining his well-digested knowledge of the universe with profound intuition, he bequeathed us this promising gem of an idea. To our shame we, posterity, have done bugger all with it for two centuries. The sun may influence climate and hence agriculture? Now THERE's an idea!

What a contrast with the army of intellectual pygmies of today in the Global Warming Industry! There are legions of academics with unprecedented access to data; bathed in data; swamped by data; inundated by data. Perhaps this very sensory overload explains why - as Churchill might've said - so much is paid to so many for so few scientific breakthroughs. The vast majority of scientists - at least of those who have a media presence - peddle the outrageous myth of Global Warming. With a few honourable exceptions, the majority view is that the pernicious gas carbon dioxide is heating up the Earth. When questioned as to why the effect of Thermageddon is so subtle as to be imperceptible they trot out the standard answer: "Hah! Give it a century and you'll see how right we are!" As sea levels change imperceptibly, the great threat is now said to be a rise of "of the order of a metre per century". This suggests that the timescale for concern is now - in the plural - centuries. Ah! It's in the 22nd and 23rd centuries that the great flood threatens! In one of Chaucer's stories a "learned" student deceived his ignorant landlord into spending the night in a wooden barrel in order to survive the impending flood. Said student used the night to have his wicked way with the landlord's wife. Those who peddle today's apocalypse myth is no less deceitful.

Now, correlation is not causality. But here's a promising correlation between climate and solar activity:


The above graph appears in a 2010 paper by Mauas et al of Argentina's Instituto de Astronom´ıa y F´ısica del Espacio:  http://www.iafe.uba.ar/u/pablo/Papers/jastp.pdf

When the Parana River flows at its mightiest, solar activity is at its peak. Does one cause the other? Does some other factor cause both? Or is this empty coincidence? If there truly is a link, what, precisely is the mechanism? Henrik Svensmark's hypothesis - that solar activity modulates galactic cosmic ray (GCR) penetration of the atmosphere and consequently cloud seeding - fits the bill nicely. The CERN laboratory at Geneva confirmed the GCR/cloud causal link in summer 2011. Bless 'em.

Until the Global Warming Gravy Train so badly corrupted science, conjectures remained mere conjectures until precise mechanisms of causality were described, and predictions were confirmed by observation, and repeatability was established. The wishy-washy woolly scoundrels dining out on the Great Global Warming Hoax keep their massive scam rolling by issuing vague unfalsifiable predictions...  and then have the barefaced audacity to whine about the need for extra "funding" to spin it out further. Shame on them!

Stop Press: The Maldives have gone under! Cancel the new airport: it's too late.

                           Maldives Cabinet Signs Climate Change Document 20 Feet Under Sea

It Comes, It Goes

The Global Warming Hypothesis. A few years ago, having been alarmed - and largely convinced - by Al Gore's film An Inconvenient Truth, I decided to seek confirmation by my own devices. Rather than take the experts' word for it - clever and sincere though they clearly were - I would devise my own tests. Some of these experts were hero-figures such as the great geneticist Steve Jones and the sainted David Attenborough. Surely, I thought, the authors of The Language of the Genes and Life on Earth wouldn't join in with a fallacy; with sodding groupthink. It Steve & Dave say it's so then, I reasoned, so it must jolly well be. But (ah, the curse of having an independent mind) I needed to satisfy myself.

Of the many dimensions of Global Warming, I chose to look at the Earth's icecaps and glaciers - the "cryosphere". There were other aspects (such as sea levels and temperature records) worthy of some forensic digging, but I chose the cryosphere.

The icecaps, it was asserted, were melting. The data upon which this claim was based must, I thought, surely be available. Let's do some digging! But it was easier said than dug. For every argument there was an equal-and-opposite counterargument. Wherever I looked for a dataset which would serve as a proxy for global temperatures - a gold standard - there were caveats, reservations, ifs-and-buts. Confusing and contradictory.

And then I discovered the Great Aletsch Glacier. Well, I didn't ackchooally discover it. Neither did Hanspeter Holzhauser, the Swiss glaciologist. But this fellow knows the Aletsch better than a mother knows her baby. He has studied it from every angle, literally and metaphorically. The techniques used are fascinating; dendrochronology is but one part of HH's toolbox, but that's another story. His studies have yielded the following graph:

[Click to enlarge.]

I think you'll see what I see. But first, let's make two assumptions here: (i) Over these timescales, temperature variations in this part of Austria are representative of worldwide variations. (ii) The length of the Aletsch Glacier is directly related to temperature: a cold century produces a bigger glacier tongue than a toasty century. Are these assumptions fair? Not entirely. The Kilamanjaro fiasco indicates that glaciers are not a perfect proxy for current temperature. Warmists loudly attributed Kilamanjaro's reduced icecap to rising temperatures; the decisive factor turned out to be deforestation and consequent reduced precipitation. (Warmists, with chaming asymmetry, trumpet the retreat of glaciers as supporting their case but are conveniently silent on historical lengthening. Perhaps they whisper: "Inconvenient. Strewth!")

Today's Aletsch Glacier is short - shorter than in living memory! Ay, there's the rub: In living memory. We would never say, "Huh, this tree isn't growing: I've been watching it for an hour now and it's the same size!" We would never say, "My bank balance has risen this past week. At this rate I'll be a millionaire in a year!" No, if you're gonna extrapolate you have to apply an appropriate timescale. And, if Mr. Holzhauser's magnificent graph is accurate, a piffling century is not an appropriate timescale. Those who draw conclusions using an inappropriate timescale are either mistaken (and subject to discovering their error of judgment) or dumb (unfortunate) or biased by ideology (religious and political types).

The Aletsch has been coming and going over the centuries. It just so happens that it's been a-going since 1860. Which doesn't neccessarily mean that it'll start a-coming again in the next few years. Even if it continues to recede for another decade or three, any claim that its current rate of recession is unique and unprecedented is not borne out by its 3200-year record of coming and going. The Aletsch says that, far from our planet having entered some neoapocalyptic end-of-days, it's business as usual.

Update 19 Mar 2012

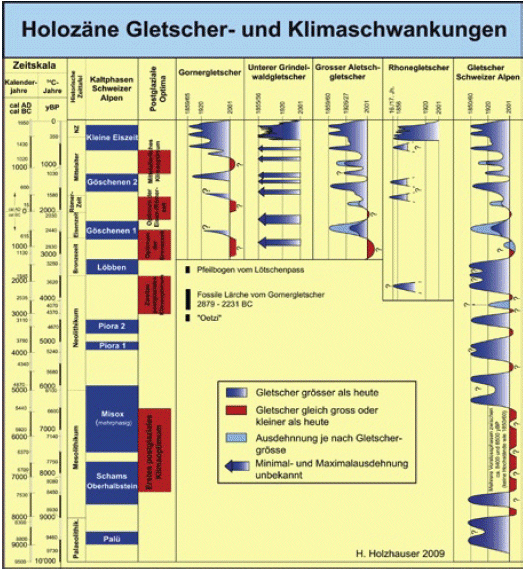
The last ice age ended 11,700 years ago. The 3500-year record shown above is thus one third of the Holocene -  the interglacial period we are now in. Could it be that these 3500 years are atypical? Could it be that the Aletsch is atypical; that other glaciers tell a different story? Well, the answer is no. Here is a paper giving a bigger picture: http://www.ngbe.ch/upload/pdf/Hanspeter%20Holzhauser.pdf
Here's a chart extracted from it:


Note the Aletsch column which includes the 3500-year chart above tipped on its side. This chart gives us a 10,000 year history - almost the entire Holocene period.

The author - our friend Holzhouser - says, "Around the middle of the 19th Century, alpine glaciers advanced to their last maximum extension within the Holocene." Think about that. If anything is worthy of the description unique and unprecedented so beloved of global warming scaremongers it's that 1860 maximum advance of the glaciers. That advance was so alarming that the Catholic church organized processions to pray for the halting of the advancing tongue of ice as it gobbled up precious pastureland. It worked! The priests prayed and the beast retreated. The subsequent retreat is no more alarming than the tide going out; it is entirely within the range of historical variation.